02 · June 2026
Propeller Aerodynamic Analysis — BEMT + CFD
Aerodynamic analysis of a two-blade propeller. I computed its performance with blade element momentum theory (BEMT) in my own Python script and checked it against CFD simulations in Ansys Fluent (MRF, k-ω SST).
Specifications
- Propeller
- two-blade, D = 0.5 m
- Rotational speed
- 3000 RPM
- Flight speed range
- 0 – 30 m/s
- Airfoils
- NACA 44xx (r/R = 0.20 – 1.00)
- Turbulence model
- k-ω SST
- CFD technique
- MRF (Multiple Reference Frame)
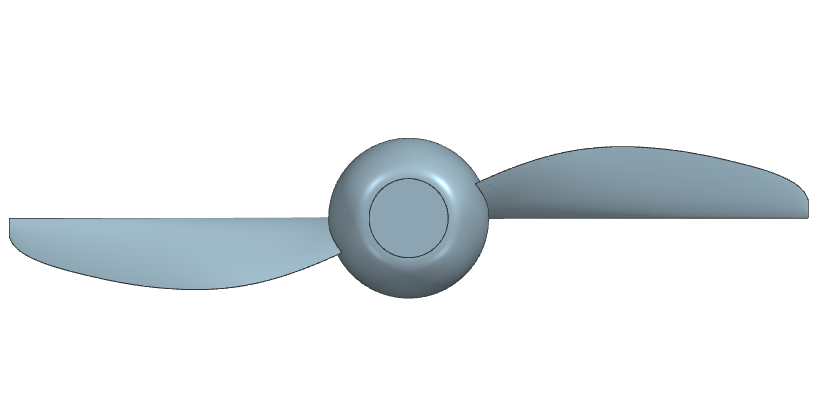
3D model — propeller geometry
Drag to orbit · click first, then scroll to zoom
Loading model…
Could not load the 3D model
Project objective
I wanted to see how a two-blade, 0.5 m propeller performs at a constant 3000 rpm across flight speeds of 0–30 m/s. I worked it out with two independent methods and compared the results:
- BEMT (Blade Element Momentum Theory), a fast analytical method. It gives thrust, torque, power and efficiency, plus the load distribution along the blade.
- CFD in Ansys Fluent, full-geometry simulations that I used to check the BEMT numbers.
Methodology
BEMT method
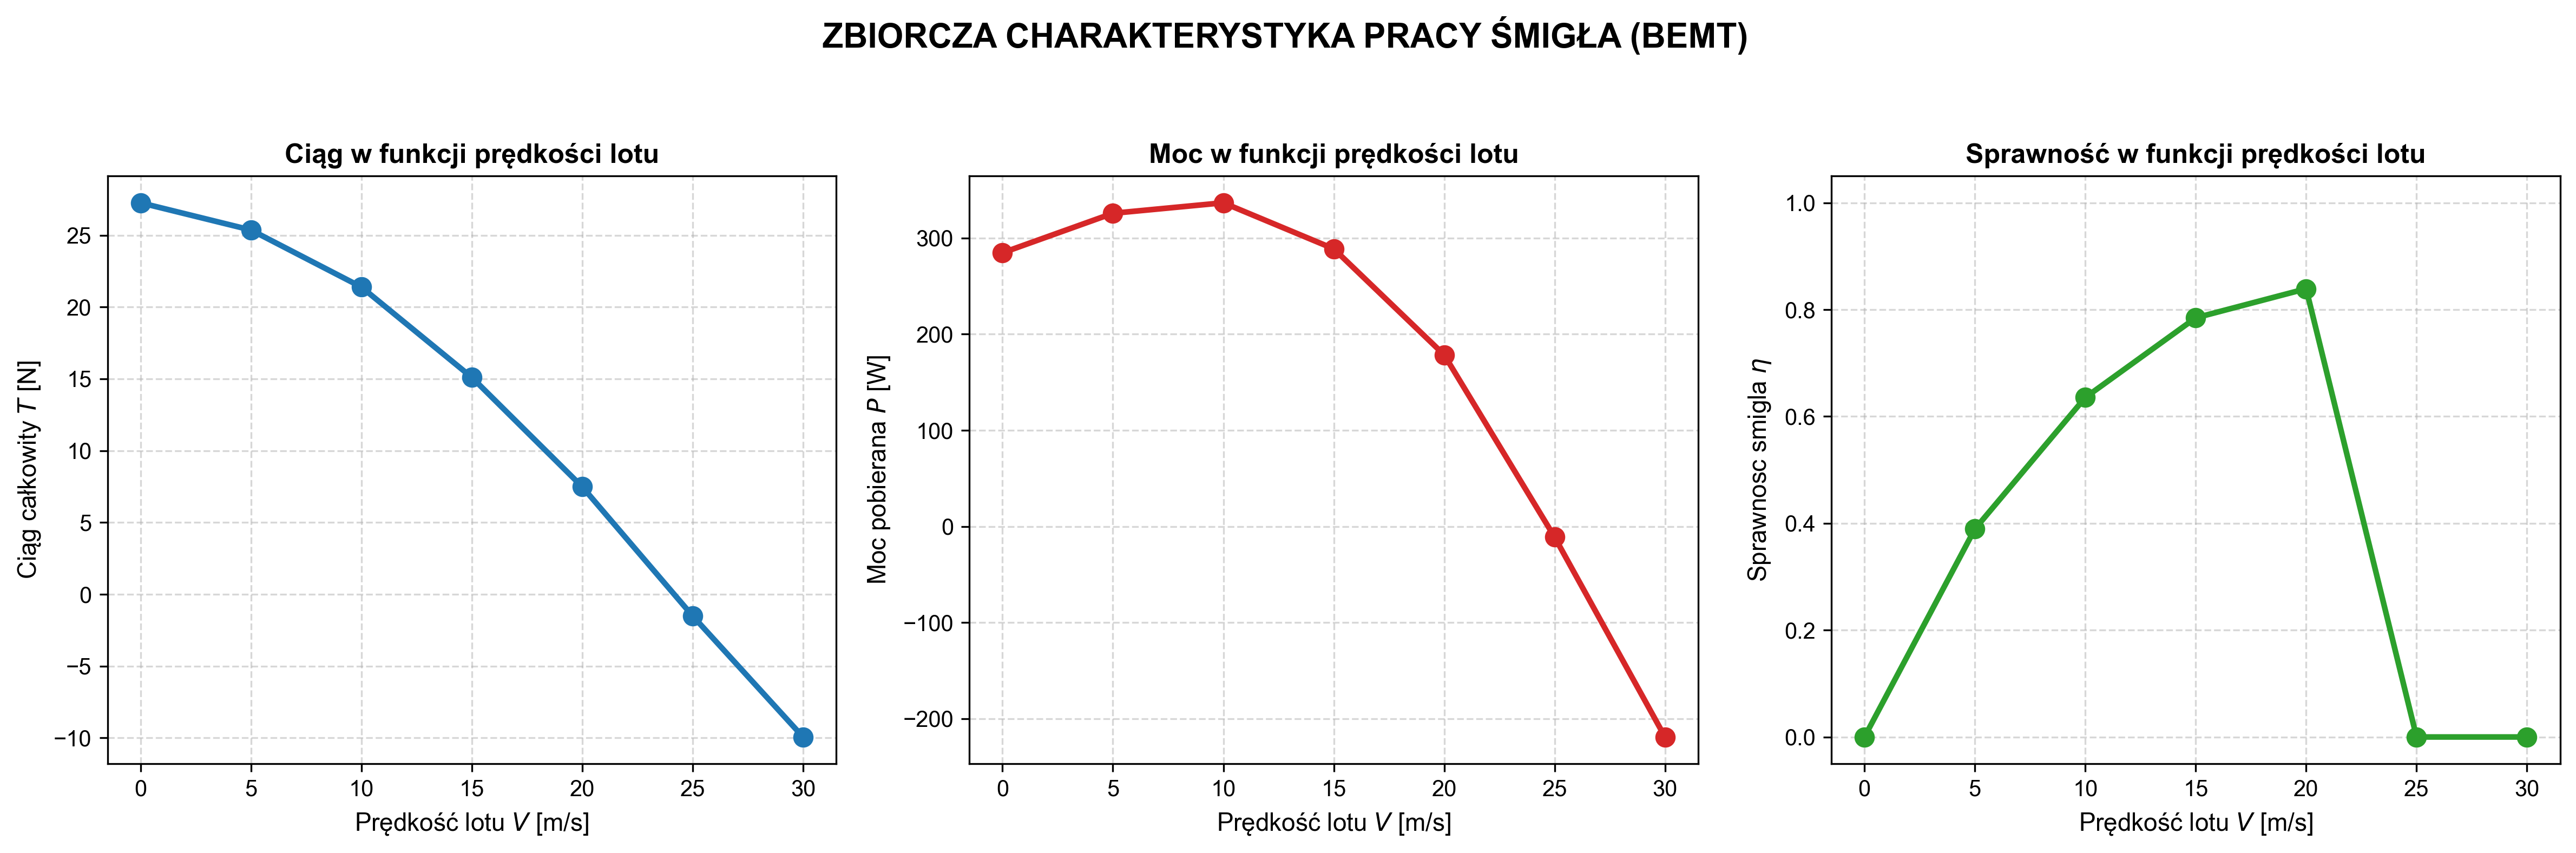
I wrote the analytical side as my own Python script (NumPy, SciPy, Matplotlib). It iteratively solves the blade element equations with axial and tangential induction factors, using NACA 44xx section data at radial stations r/R = 0.20–1.00. For each flight speed it returns the overall characteristics (T, Q, P, η) and the thrust and torque distribution along the blade.
CAD model
I built the geometry in Siemens NX from sections. At each radial station from r/R = 0.20 to 1.00 I modelled the upper and lower aerofoil surfaces separately, which came to 14 section files (r50, r87, r125, r162, r200, r237, r250), then lofted the blade surface through them. The base assembly is model1.prt.
All the .prt files are in the repository’s model/ directory. The 3D view above is an STL export of the same assembly; a browser can’t open the .prt files themselves, since that is Siemens NX’s closed format.
CFD simulations
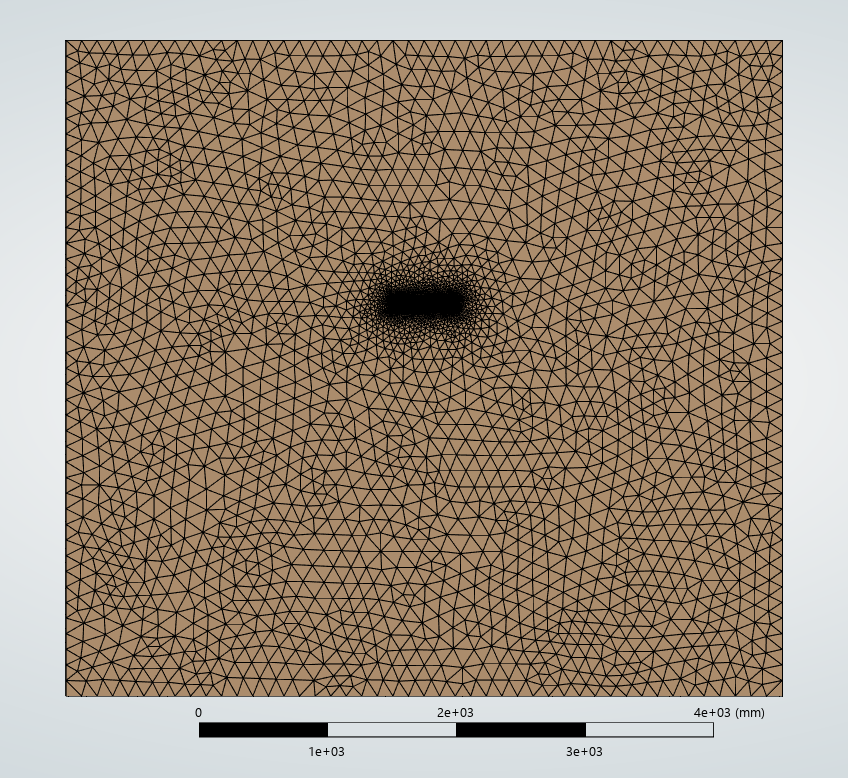
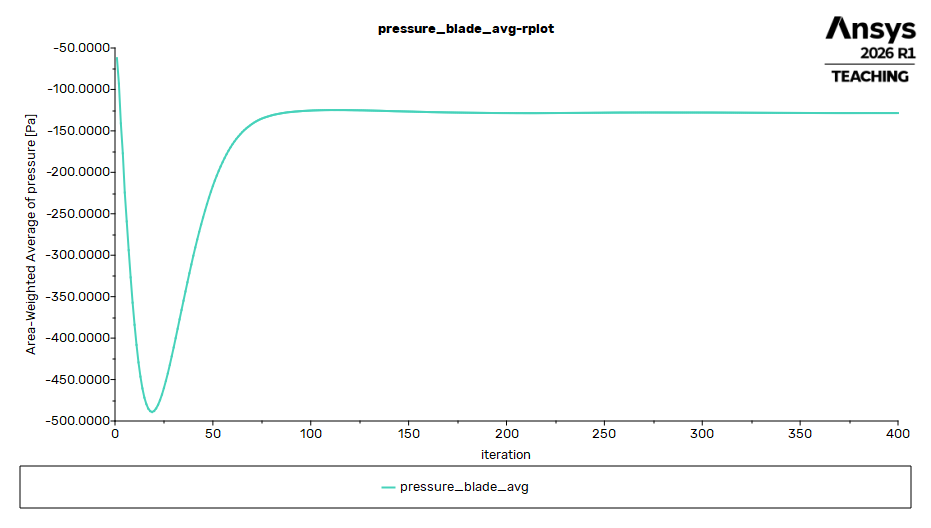
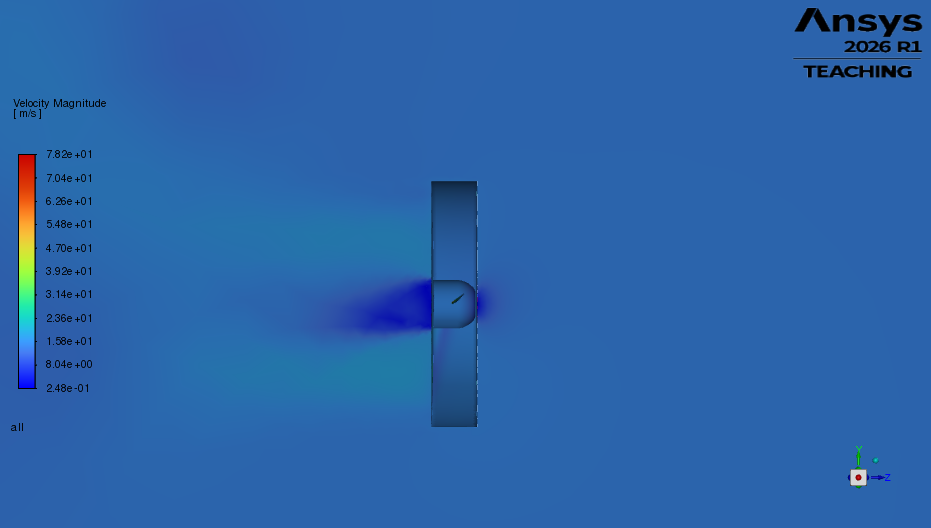
I ran the simulations in Ansys Fluent with the MRF (Multiple Reference Frame) approach and the k-ω SST turbulence model, judging convergence by thrust, torque and residuals. I modelled half the propeller (a half-symmetric model), so the CFD results were doubled.
Validation
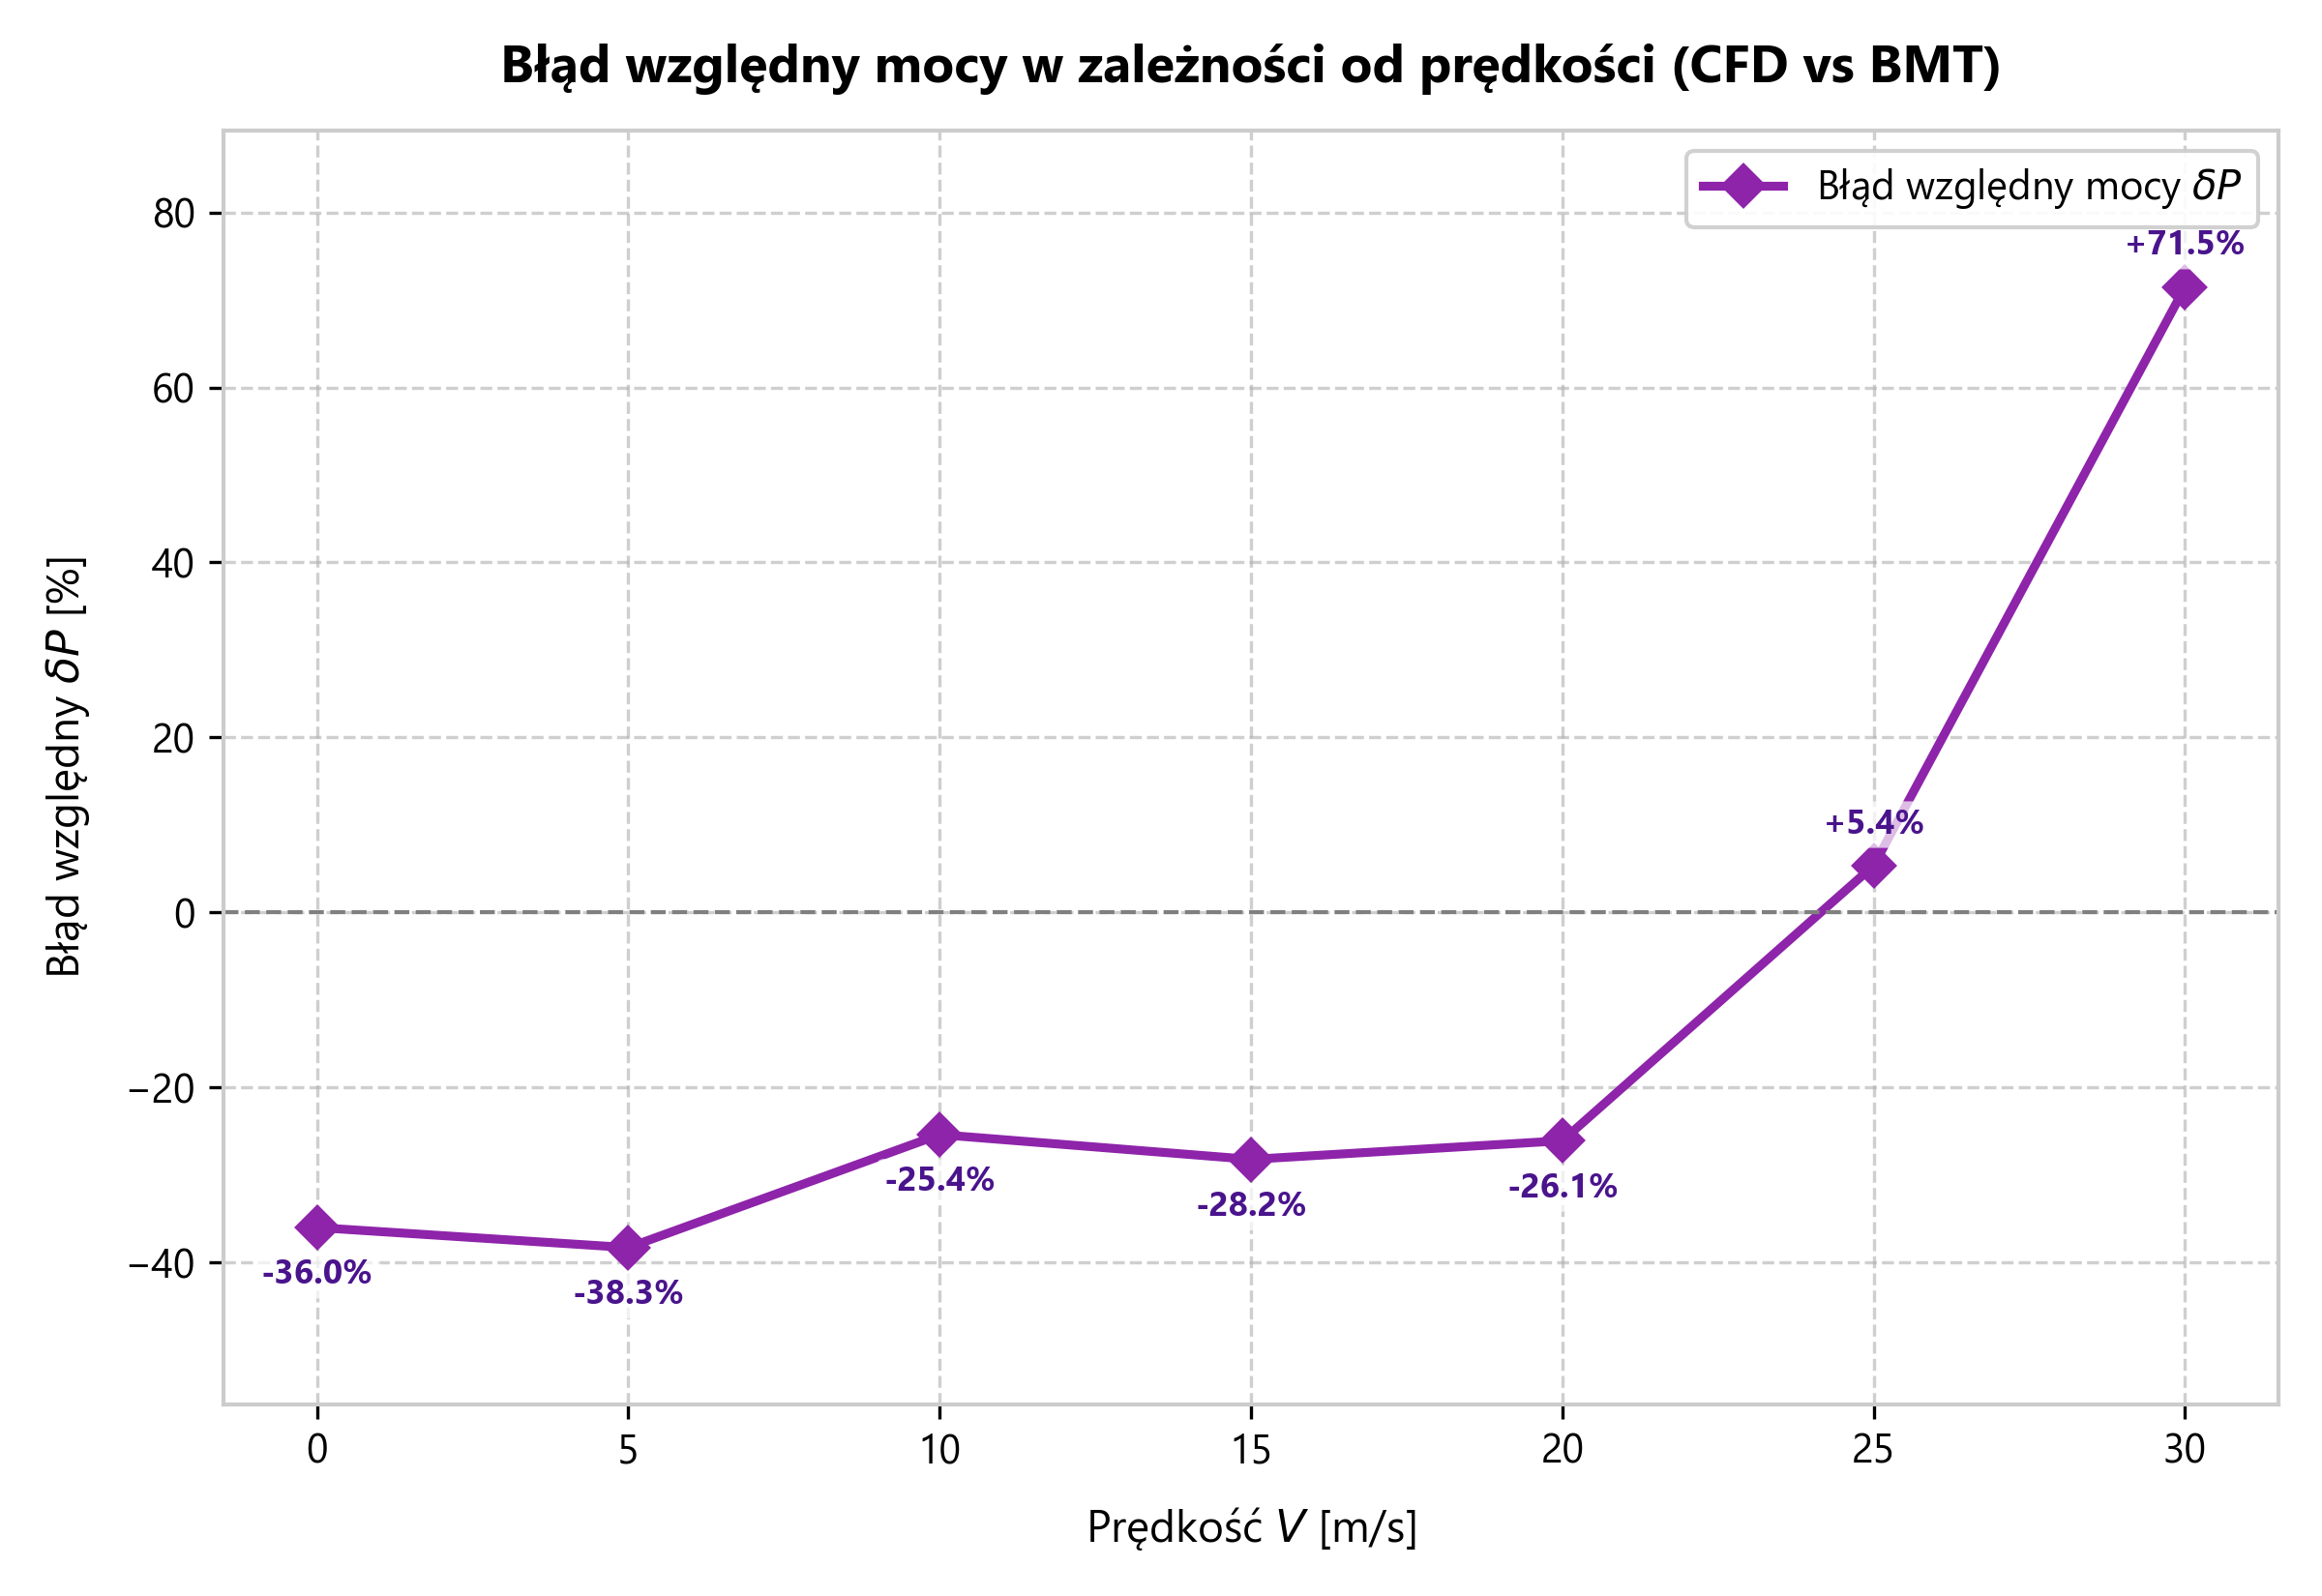
I compared both methods at seven flight speeds between 0 and 30 m/s and computed the relative errors in thrust, torque, power and efficiency.
Results
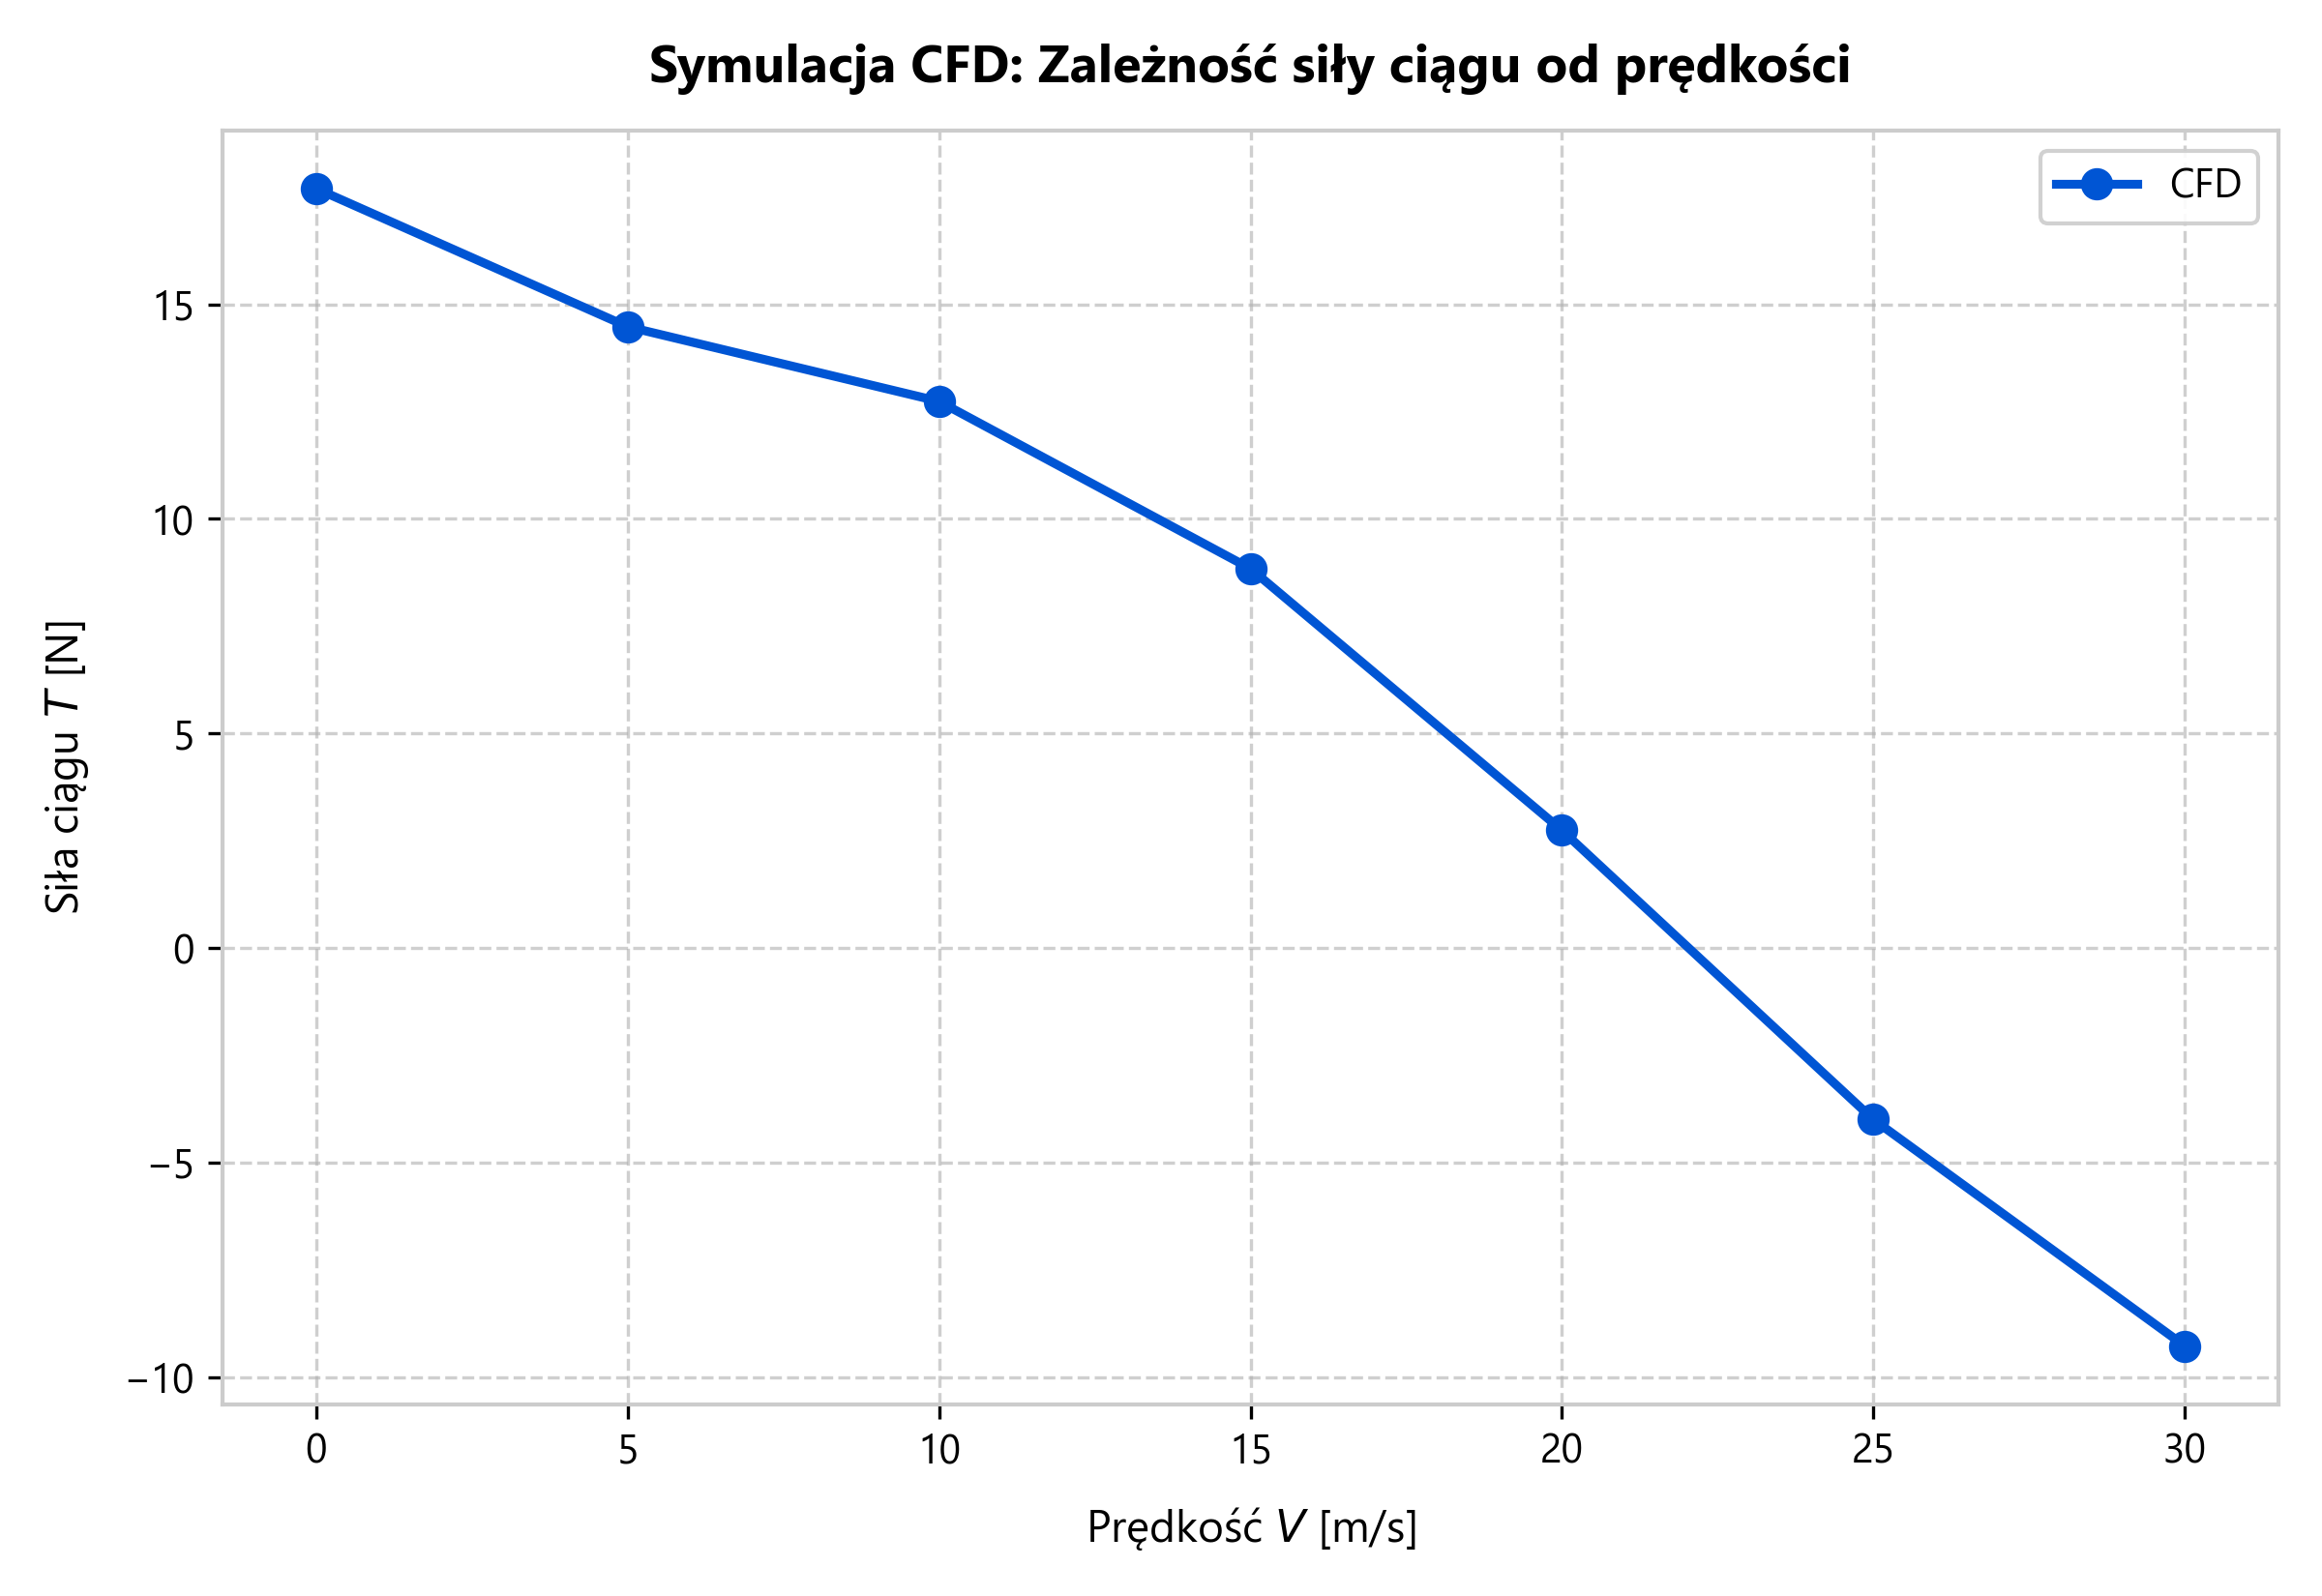
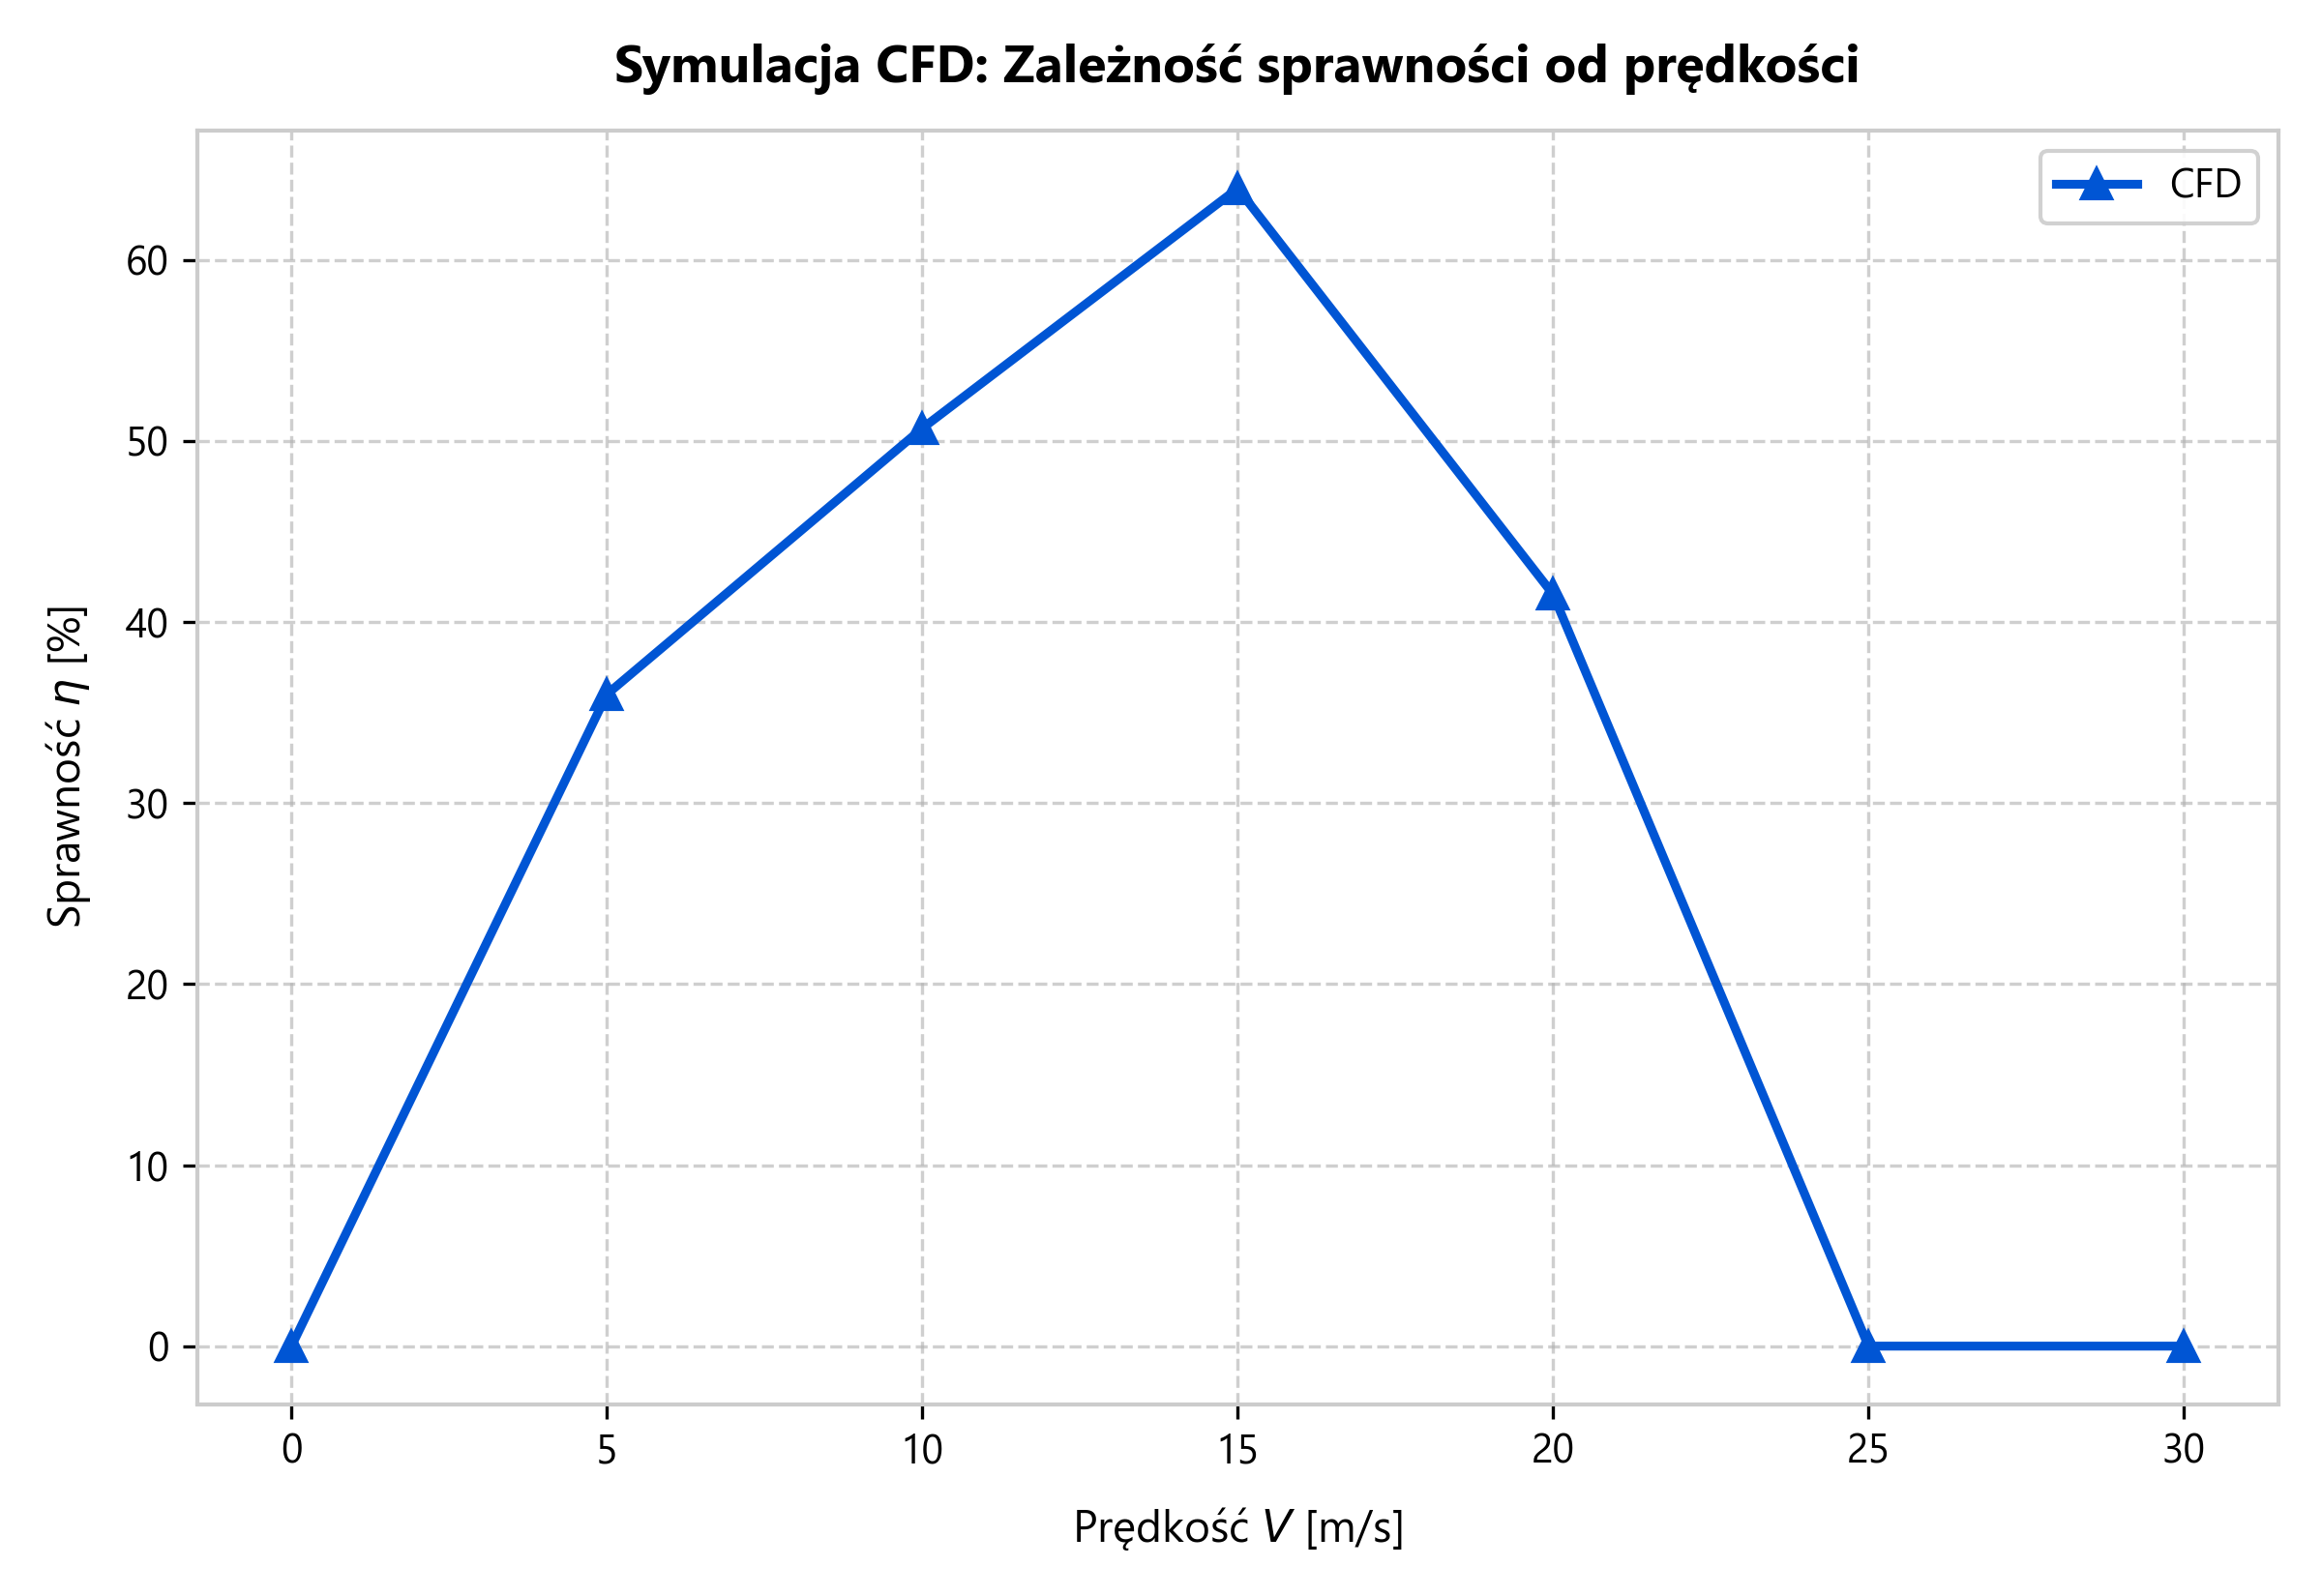
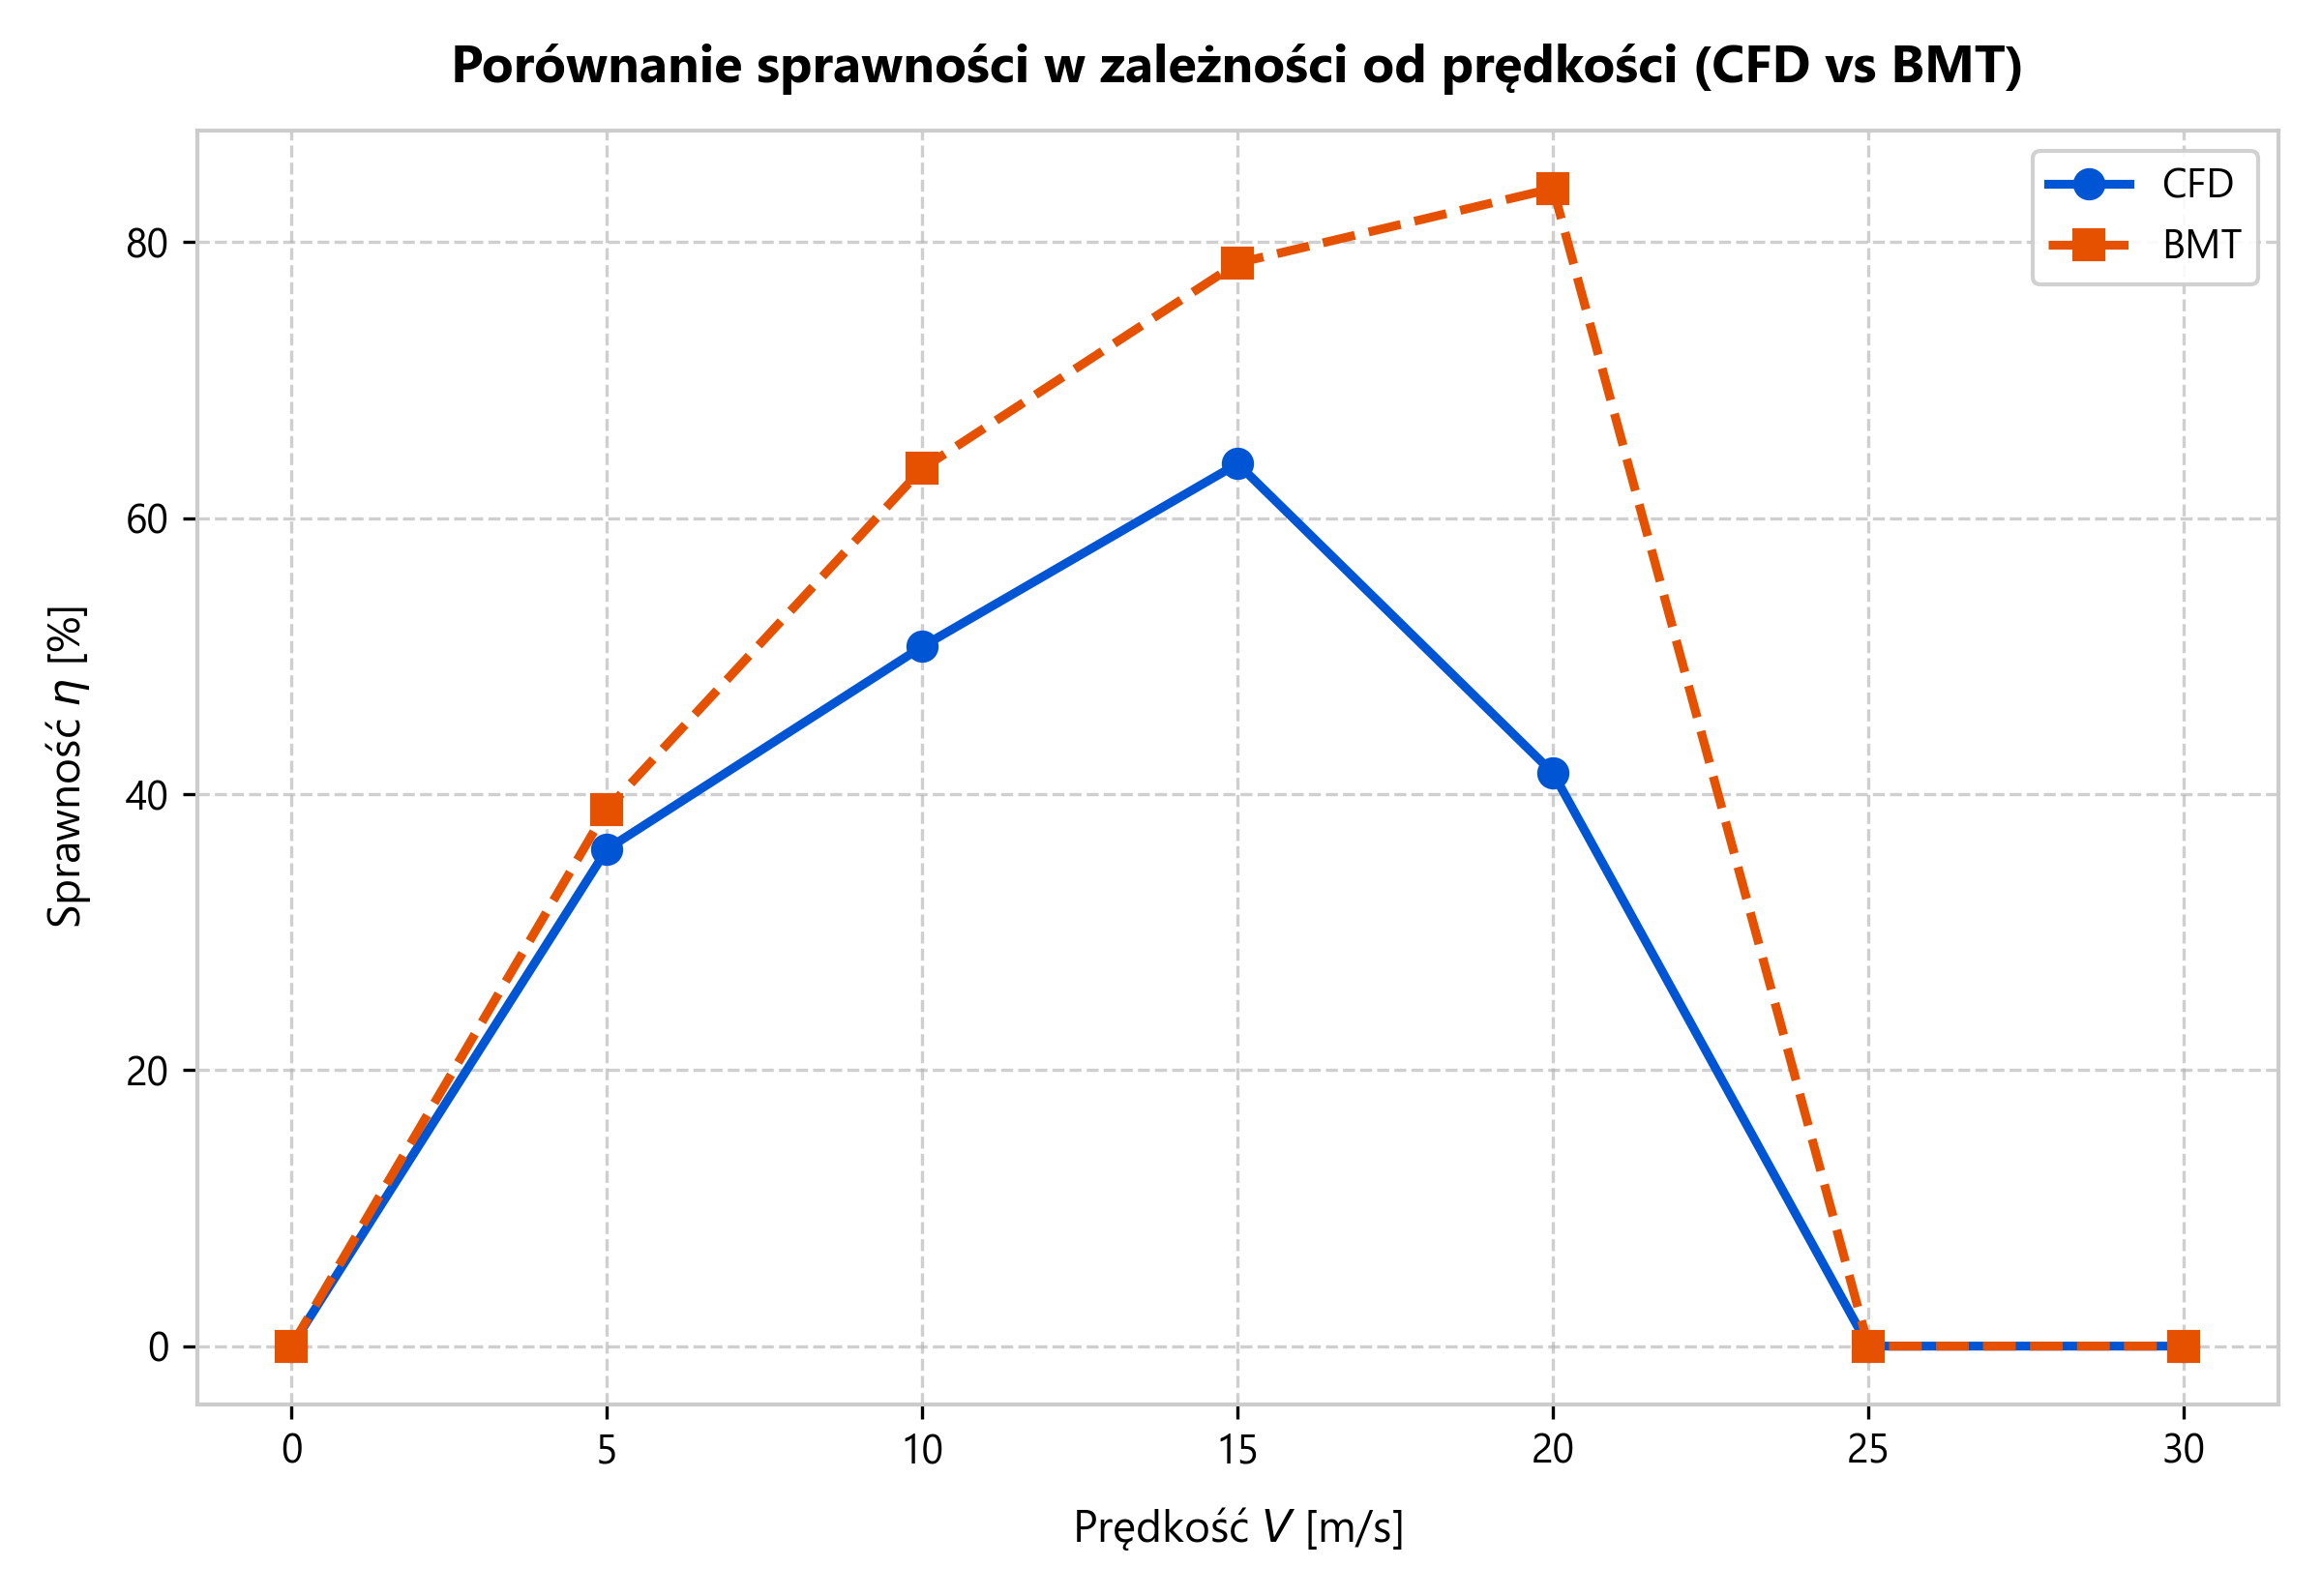
| V [m/s] | T CFD [N] | η CFD [%] | T BEMT [N] | η BEMT [%] |
|---|---|---|---|---|
| 0 | 17.70 | — | 27.26 | — |
| 5 | 14.48 | 36.0 | 25.36 | 38.9 |
| 10 | 12.74 | 50.7 | 21.39 | 63.6 |
| 15 | 8.84 | 64.0 | 15.11 | 78.5 |
| 20 | 2.74 | 41.5 | 7.49 | 83.9 |
| 25 | −4.00 | — | −1.51 | — |
Both methods show the propeller going into windmilling, with thrust dropping below zero, at J ≈ 1.0–1.05. BEMT puts peak efficiency at about 84% at 20 m/s. CFD gives consistently lower thrust, by about 35–40% at low speeds. I put that down to the simplifications of the MRF model and to BEMT not fully capturing induced losses.
Tools
Python (NumPy, SciPy, Matplotlib) · Siemens NX · Ansys Fluent (Meshing + Solver, MRF) · CFD-Post · LaTeX
Results gallery